Smart City · Data Platform · GovTech · 2023 to 2024
NEOM Data Mesh
Turning a cognitive city's data into products people can actually use
What I owned
- UX strategy
- Data visualisation
- Team leadership
- Roadmap and KPIs
- Stakeholder alignment
- Prototype releases
- Working with Product, Engineering and Data
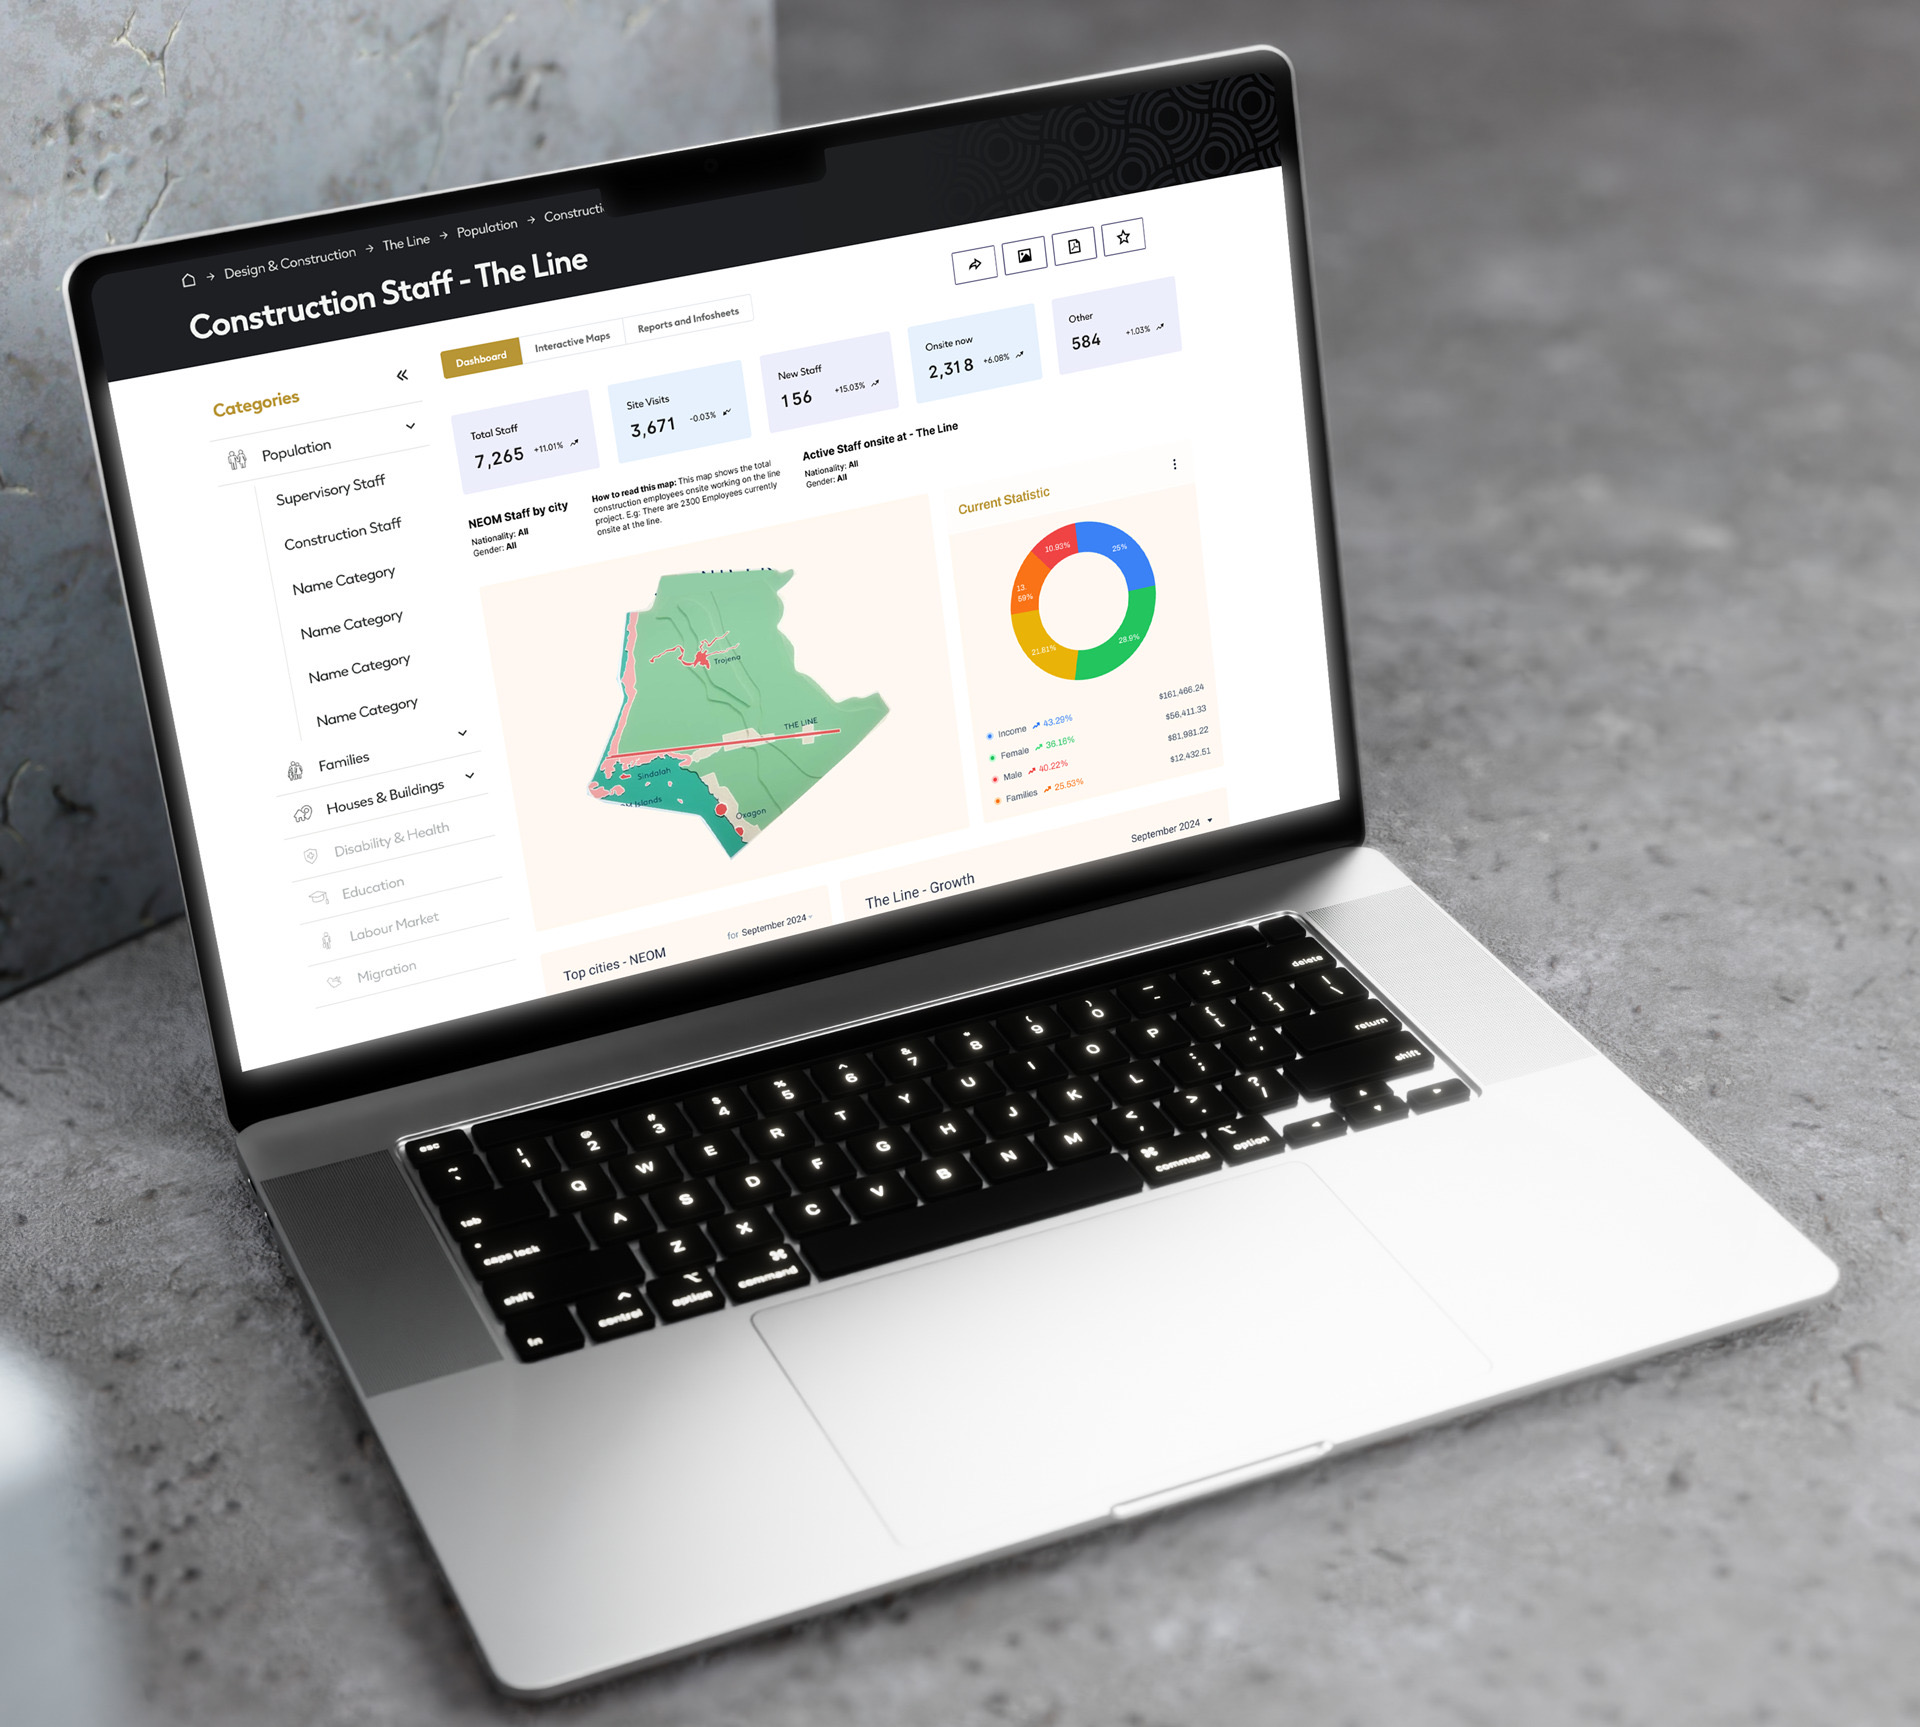
A data mesh for a cognitive city
NEOM is building a city from scratch, and that city produces vast streams of data from sensors, IoT devices, enterprise systems and citizen interactions. A data mesh treats that data as a product: owned by the domain that knows it best, governed centrally, and shared with anyone who has the right to use it.
NEOM Data Mesh (the NEOS platform) is where that happens. It helps people organise, manage and securely route large sets of data to the right users, breaking down silos so teams can turn data into insight without drowning in it.
Who it is for
Data engineers
Run the full process of retrieving data, compiling it and creating data products.
Data scientists
Use data products to build advanced analytics.
Data analysts
Use data products to generate insights and reports.
Project managers
Browse a library of data products to support their Cognitive Cities teams.
C-level executives
Read analyses on dashboards and make informed decisions.
Vast data, very different people, too much complexity
Most of the data NEOM already had was going nowhere. It sat unused, couldn't be shared, or was stored more than once. And the people who needed it ranged from data engineers to executives, each with very different expertise and very little time.
Complexity of data management
Organising and managing vast amounts of data while protecting privacy and integrity.
Diverse user needs
One platform for data engineers through to C-level executives, each with their own requirements and level of expertise.
Cognitive overload
Making complex data processes understandable without overwhelming people, so they could actually navigate and use the platform.
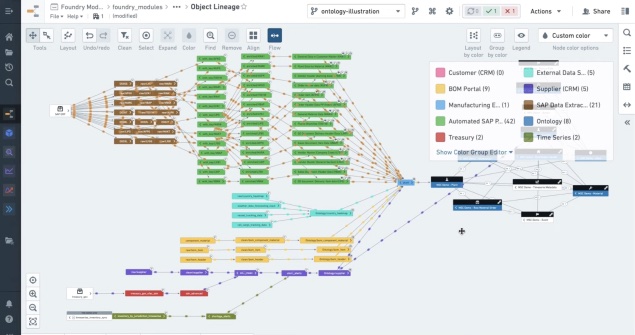
Make the invisible visible, then ship it
I joined as design lead in a cross-functional product team and supported three designers. My job was less about screens and more about clarity: turning a highly technical concept into something every stakeholder could see, understand and agree on.
Worked with
- 2 product managers
- Product owner
- Service designer
- UI designer
- 3 designers supported
Visualisation specialist
I worked through volumes of data documentation, tooling and real-world problems to create a simple visual story of the concept and the product. This became the shared picture the whole programme worked from.
Strategy and planning
With the product managers and product owner I shaped the roadmap and the KPIs we would track, and a delivery strategy that kept us shipping on time without cutting corners on the problems that mattered.
Prototype releases
I planned and released a product prototype ahead of every stakeholder meeting, working hands-on with the development team in a fast, iterative rhythm.
Show it, don't describe it
Four barriers stood in the way: people didn't clearly understand the data they managed, many couldn't tell a data lake from a data mesh, stakeholders couldn't picture the product from words alone, and expectations of what it would do were misaligned.
So the strategy was to make the product visible as early as possible. The environment was fast and often chaotic, and I made a deliberate call: get the concept and features right first, polish the interface later, and put something real in front of stakeholders at every meeting.
KPIs from day one
Performance indicators agreed up front, so success was measured, not debated.
Prototypes as the conversation
Every stakeholder meeting started from a working prototype, which aligned expectations faster than any document could.
- Discover
- Stakeholder interviews with engineers, scientists, analysts, project managers and executives
- Surveys for quantitative needs
- Data analysis to find pain points
- Design
- Empathy maps and personas for each user group
- Data visualisations and user journey flows
- Low-fidelity wireframes
- Test
- High-fidelity wireframes and interactive Figma prototypes
- Usability tests with users and stakeholders
- Iterate
- Refinements driven by test results
- A/B tests to compare design approaches
- Feedback from data engineers shaping the features
Calls that shaped the platform
Concept before polish
In a fast, often chaotic environment, I prioritised getting the concept and features right before refining the interface.
A prototype at every stakeholder meeting
A working product aligned expectations faster than any written specification.
Three ways in
The platform is organised around building, finding and using data, so every user group has a clear starting point.
One platform, three ways in
Each core problem got a direct design answer, and the product was organised around three ways of working with data: building it, finding it and using it.
Complexity of data management
ProblemOrganising vast data while protecting privacy and integrity.
SolutionAn interface that strips out unnecessary complexity, with privacy and access controls built into every data product.
Diverse user needs
ProblemEngineers through to executives, all with different needs.
SolutionPersonas and empathy maps for every group, guiding decisions so each workflow fits the people who use it.
Cognitive overload
ProblemComplex processes that overwhelm people.
SolutionContextual help, a clear visual hierarchy and consistent patterns so people find the right data quickly.
Key features
Data landscape
Expert users build data pipelines and meshes in a canvas view that shows the flow visually, or a form view for detailed inputs.
Data catalog and Exchange
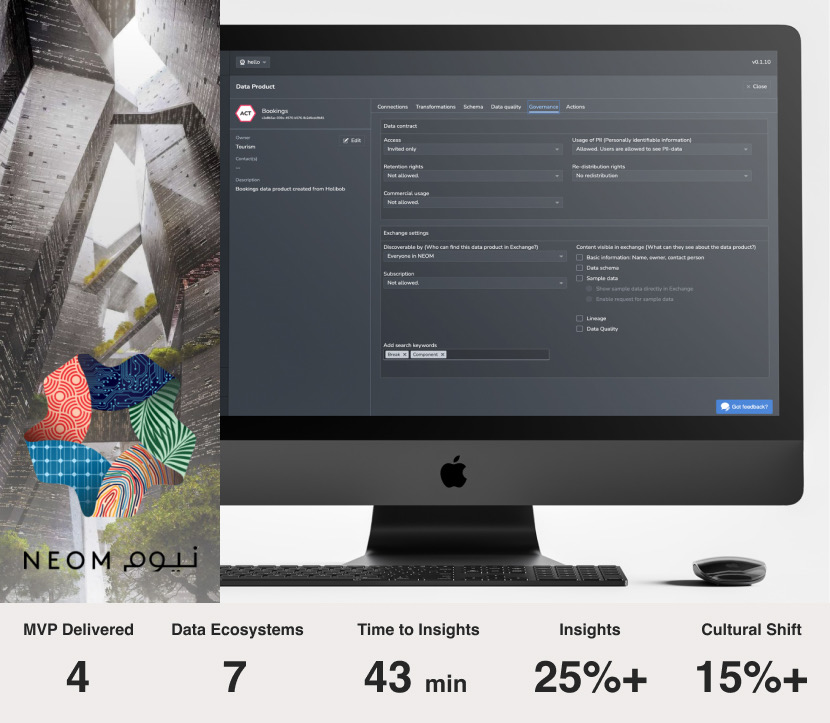
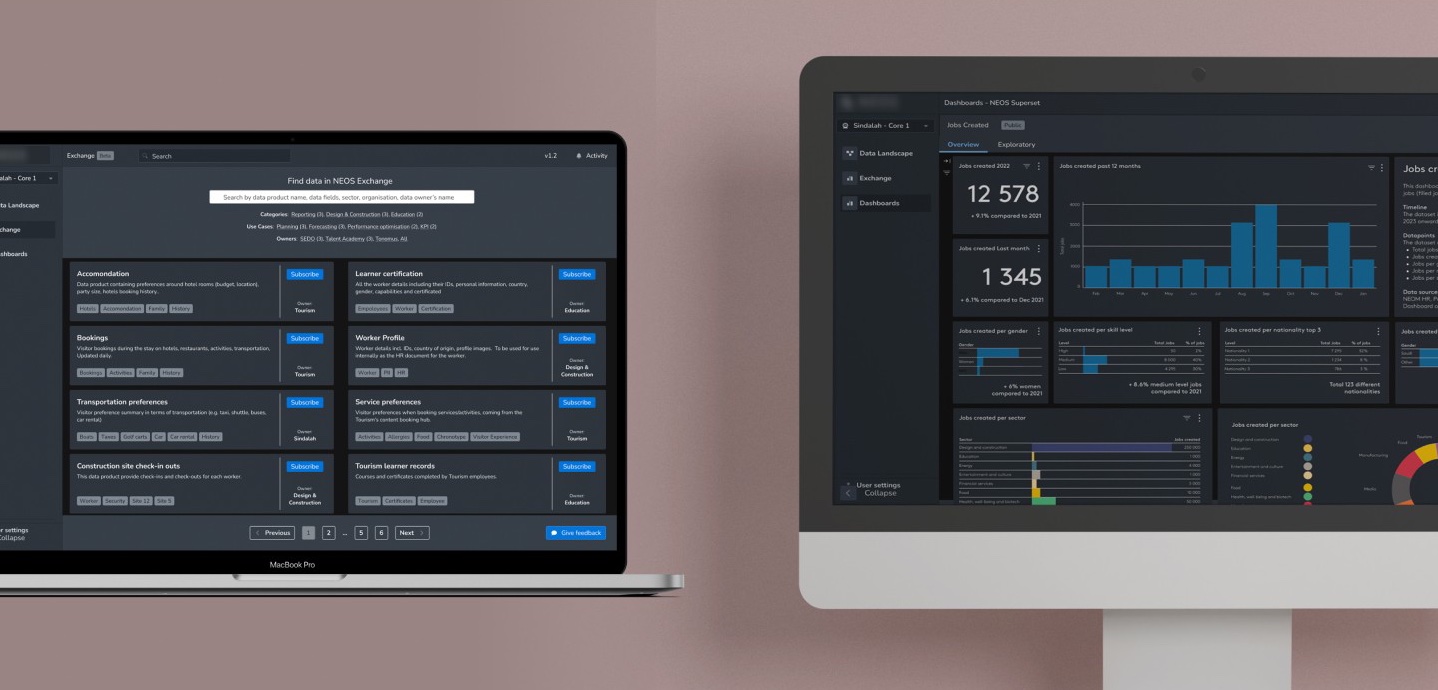
A searchable library of data products, available according to permissions set by each data product owner.
Dashboards
Analytical scenarios built on data products, integrated with Superset, Power BI and Tableau.
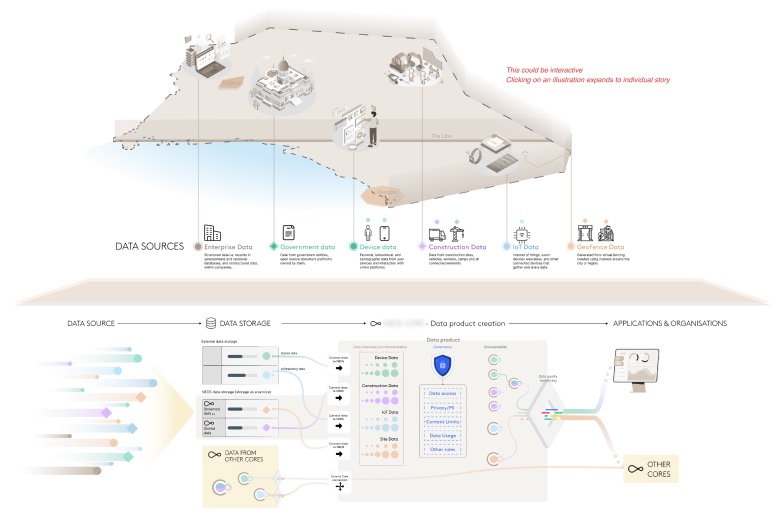
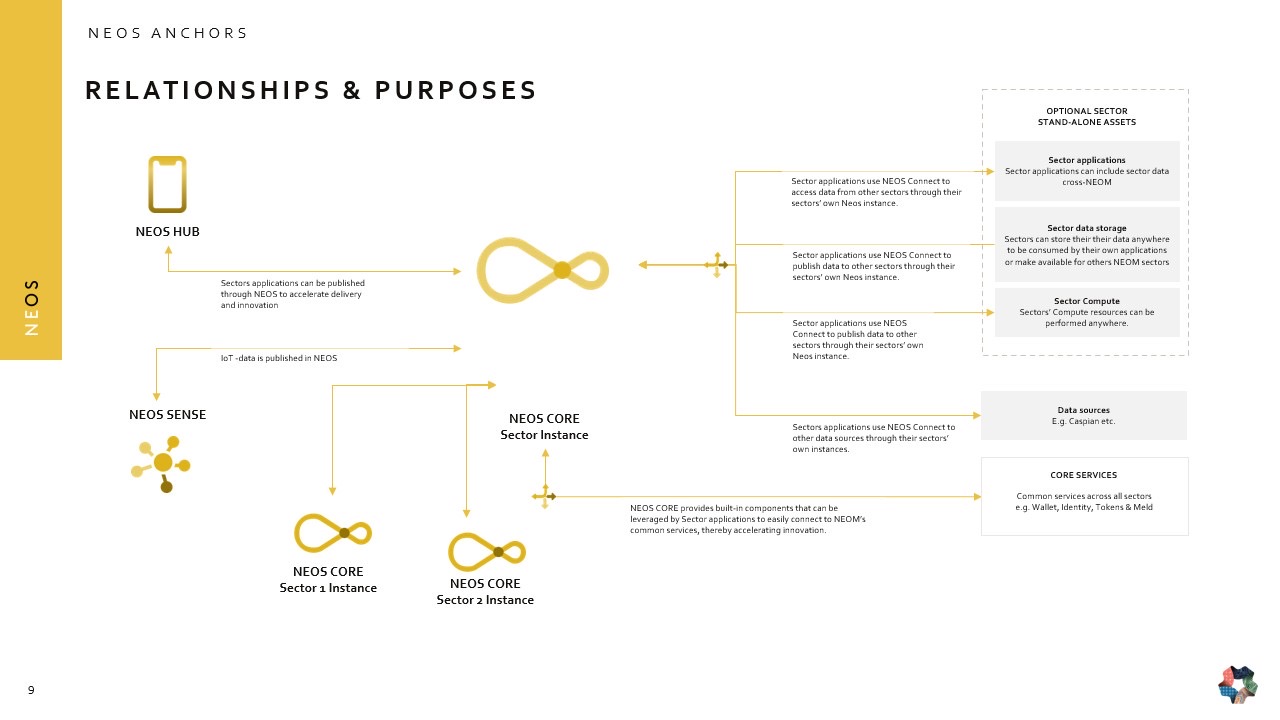
Calm interfaces for dense data
A dark, low-glare interface built for long working sessions, where governance, discovery and analysis each have a clear home.
Simpler data, better decisions
Continuous testing and iteration produced a platform that serves everyone from data engineers to executives. It simplifies data management and improves collaboration and decision-making across the organisation. The work continues as the city grows.
Improved user experience
Constant testing and iteration led to a platform that makes complex data processes approachable.
Increased efficiency
People spend less time managing data, with a 20% decrease in turnaround time for data tasks.
Enhanced collaboration
The data catalog and dashboards helped teams and organisations work from the same data.
User satisfaction
Stakeholders and users reported high satisfaction with the platform's usability and functionality.
In data-heavy products, the most valuable design work happens before the UI: making a complex system visible so everyone can agree on what is being built. Prototypes did more for alignment than any specification.
Next project
NEOM Bay Airport →